
THE WORLD IN ENERGY
- Apr 19, 2021
- 9 min read
Whilst writing a blog on hydrogen energy storage, we found ourselves digging into the global energy trends to understand what was happening to the overall global energy mix, and more importantly, where it is heading. Predictions don’t usually end up being correct, by any means, and put simply, we are not economists, but this is our attempt at dissecting the energy market.

A great chart to start with is the energy consumption by source which has been featured regularly on social media in recent months.
The trend towards greater energy consumption is growing at an alarming rate (~20,000TWh in the last decade).
Firstly, let us try to understand where this trend is coming from. A key driving factor that affects the amount of energy we use is the increasing use of machines, automation and technology. If you look at any industry, it is visible that machines and automation have made things easier for humans; they get the job done quicker, or looking at it another way – the work throughput is a lot greater in the same amount of time.

A significant influence on energy usage will be population growth – as seen in the accompanying figure. Some observations from this chart:
It could be said that the energy consumption is proportional to the population growth. Excluding some global events that triggered the slight variance in energy consumption in 1980’s and 2010; this is largely the case.
The population of Africa and Asia is growing at a much faster rate than the other regions. The less developed countries tend towards greater population growth rates than developed countries.
Looking at population growth trends and growth rates in particular will give us a means to predict future population growth. Only then can we try to predict how the energy demand will change in the future.

The trend is indeed growing, but the rate of growth is predicted to decrease in the future. What does this mean for the future? Well, the energy demand is still predicted to increase, but at a lower rate than it is currently. We should emphasise again though -that this is only a prediction and it may prove to be wrong, as these trends are easily influenced by major global events – the COVID-19 pandemic, for example.
To put the UK energy consumption in perspective relative to the World, the UK consumes 1.4% of the Global energy. The following chart shows the energy mix for the UK (excluding heating).

A few observations:
Firstly, the demand is decreasing, the reasons for this could be a combination of factors stemming from our push towards energy efficiency, such as better home insulation, more efficient electronic devices, more efficient vehicles, PV deployment in houses, RHI schemes etc.
The second observation is that when we compared the values for the UK energy consumption with data from BEIS (Energy Trends, 22nd Dec 2020 BEIS), the figure in this source (~1,628TWh/year) is ~75% of the number in the above BP statistical review. The difference here is thought to be from the way BP convert the energy from GJ to MWh, as noted in the small-print on their website. We will continue here by using the BEIS values, as there is a more detailed breakdown of energy usage in the BEIS data:
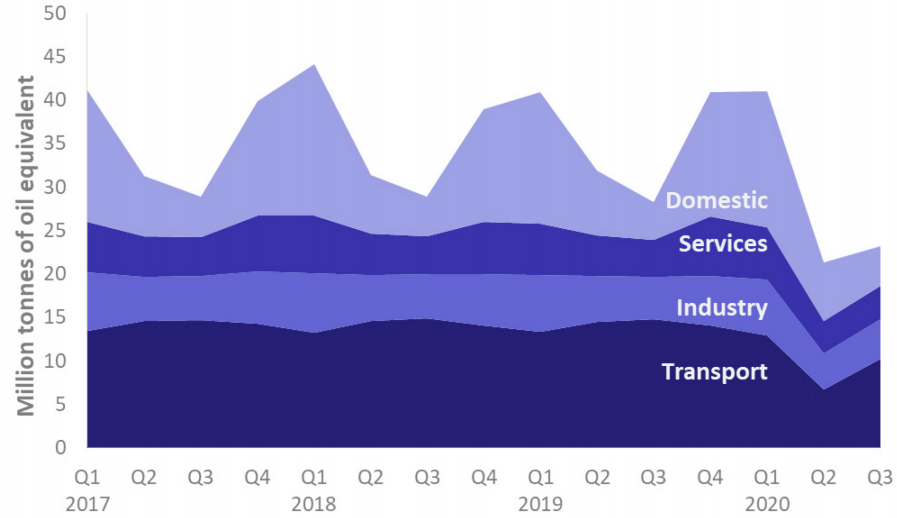
We can dissect this further and look at the proportional split of this consumption, and attempt to factor in the ban on the sale of petrol/diesel cars in 2030.

The passenger transport equivalent oil consumption is currently ~27m tons of equivalent oil (toe). For a combustion engine at 35% efficiency and an EV at 90% efficiency, this equates to 122TWh per year if all cars were electric (using IEA conversion definition). The rest of the fuel is taken up by HGVs and buses, which is ~8m tons, which in-turn equates to 36TWh per year.
We can do the same for domestic heat, by assuming ~10mtoe per quarter, and boilers with 90% thermal efficiency. Converting this demand to heat pumps, running at 300% of thermal efficiency. Phasing this in linearly to 2050, we get to 140TWh (assuming no reduction in heat demand due to warmer winters and climate change).
For completeness, we have converted services and industry aspects as well. The conversions are more challenging as it is very dependent on the end use of the fuel. For instance, using electricity may not be realistic or feasible in some scenarios, so for the option of converting renewable energy to hydrogen and then use this as the power source, we have split the total 48mtoe (12mtoe quarterly) to a third heat, and a third fuel for agriculture, but kept the final third as oil (based on the assumption that is may not be feasible for some industries to fully decarbonise). The heat calculation is done as for domestic heating and comes to 56TWh, the fuel conversion comes to 72TWh and the total is 128TWh.
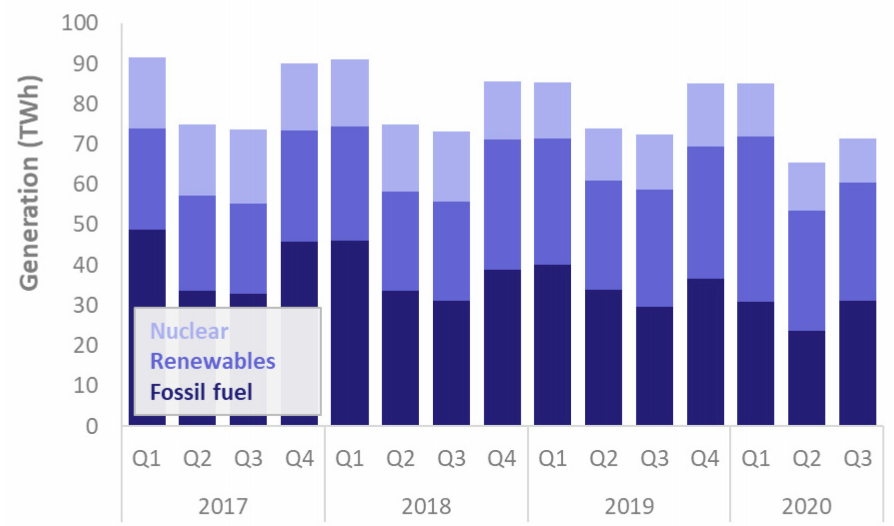
Currently UK electrical energy generation (by fuel) each quarter is on average is about 80TWh, so roughly 320TWh per year. This is represents only 20% of the total energy usage in the UK.
By 2050 the electricity generation of the UK will have to more than double, assuming all road vehicles will be electric by then; this is a substantial
increase. The plot below shows
our high-level projection, which is based on the following:
An annual drop of 1% in demand overall as seen in Figure 7;
Nuclear output remains constant (this is discussed later);
Fossil fuels are phased out;
Renewables share assumed constant for the purpose of separating how much additional capacity is needed;
Domestic EV is phased in, in two stages: linearly to 30TWh in 2030, then linearly to 122TWh in 2050; whether this is batteries or hydrogen, the assumption is that green hydrogen will be used, so the electrical generation will still be needed (we have ignored the lower efficiency of the conversion);
HGV electrification is phased in linearly to 2050, as buses are predicted to see a faster integration into cities due to the high particulate emissions concern;
No change in consumer behaviour (in reality more people may work from home in the future; on the other hand, less people will likely want to ride public transport if they can avoid it; so net result could be minimal);
Capacity factor for OW to be 50% (this may be considered conservative given Hywind’s recent 57% figure);
Note that heating has not been included which could be a significant underestimate if more heat from electricity is utilised.

There are many issues that could affect this prediction, the security of supply mainly, but we’ll come back to this. Here are some interesting facts from this graph:
If fossil fuel is phased out by 2050, and replaced by let’s say hydro power or tidal lagoon’s, only 64TWh will be needed to replace the current 146TWh of generation. This is directly related to the 1% overall reduction. The outcome is therefore very sensitive to this figure.
The actual trend in renewables is not likely to be linear, but exponential. As the date comes closer, progress is likely to be lower than required to hit the targets, and potential support mechanisms will accelerate the progress in the last 5-10 years.
Overall nuclear is likely to reduce over time as all existing sites will be decommissioned as early as 2035 (excluding Hinckley Point C). However, we kept this constant to allow for the small modular reactors roll-out that the Government is currently supporting.
The shortfall in generation is 490TWh in 2050. However, there are some debatable assumptions concerning the services and industry figures. If full decarbonisation does occur, with the use of green hydrogen replacing all fossil fuels, the total electricity needed will be ~270TWh (40%) higher than our prediction.
The plot also does not show the existing renewable sites re-powering. This will also add production pressure on the wind-turbine suppliers.
So, the big question, are we on track? The next image shows when the latest CfD round (3 and 4) comes online, and the predicted rounds to meet the target in 2050 -based on our prediction. This would see the CfD rise from 7GW per round to 9GW in 2042 .

Deepwind is an exceptionally large round at a capacity of 10GW, but if we look at the figures, a typical 10GW farm would produce ~44TWh annually, and the quantity of turbines would be in the region of 667 units (each with 15MW capacity).
So it looks like we are on track (again - emphasising that this is based on our prediction of only decarbonising the transportation sector), but what are the significant challenges that lie ahead of deploying huge offshore wind farms:
Seabed area limitations
The new sites would have to be located further and further afield, so floating wind is likely to be featured extensively due to limitations in monopile/jacket depth ranges above 50-70m ; However, means of servicing will be increasingly challenging, and maybe a floating island concept for O&M and even major component change will provide some overall project cost reduction.
Production scale-up
There are currently only a handful of companies capable of delivering such a scale of wind turbine specifically for offshore. GE’s 13MW turbines to be installed at Dogger Bank in 2024 and Siemens Gamesa and Vestas have recently unveiled 14MW and 15MW units respectively. The increase in production to meet the demand will require significant investment and time!
The World Energy Council has highlighted five areas countries need to focus on to address the energy trilemma (the trilemma is defined as: energy security; energy equity and environmental sustainability):
Transforming energy supply
Advancing energy access
Addressing affordability
Improving energy efficiency and managing demand
Decarbonising the energy sector.
So below, we came up with a few practical examples of how to implement some of these focus areas, to address some of the concerns we have highlighted.
Using smart chargers with every EV
As shown in our Electricity prediction graph, over 50% of the generation will be to provide electricity to EVs, so enabling the energy to flow in both directions is a no-brainer. The EVs will charge when there is excess grid capacity, and sell energy back to the grid when there is demand elsewhere. Key to unlocking this potential is big-data driven decisions managed by the ESO that enables and encourages competitiveness within the market. Flexibility needs to be built into the system at all levels, especially user level.
Large battery storage industrial units
The benefits here is cost reduction due to economies of scale. These certainly will not provide endless power, but rather they will deal with short term and medium term fluctuation in the grid. The sizing will be critical to each specific area on the network.
Hydrogen generation and fuel cell technology
Electrolysers can produce hydrogen that can be stored and used at a later date to produce electricity again via fuel cells. The benefits of this compared to battery storage is the storage duration aspect, and potentially (depending on the electrolyser membrane material) being more sustainable, as batteries have a limited life. Hydrogen can also be used in cars and other vehicles which would provide unlimited mileage, although the technology is not as mature as EVs.
Another area we are passionate about is of course tidal and wave energy. While wind has proven to be one of the cheapest forms of energy generation, it is not very predictable and doesn’t necessarily match up with the energy demand:
Tidal energy is completely predictable. It varies in time-of-day slightly around the whole of the UK by more than 6 hours, so it can be considered reliable baseload (for example, on the 15th of March; high tide in Wick occurred at 12:30pm, and in St Mary’s high tide was 6am). Using batteries in combination with tidal power could create a definitive baseload without relying on the production in other regions around the UK (something we plan on demonstrating soon).
With regards to wave power, the estimated global potential for wave is 11,600TWh , so this will definitely add to the security of supply for the UK. There are many cross-over and transferable skills here from the O&G market that is yet to be capitalised. Also, combining wind and wave power is something a number of project and technology developers are looking at currently (Marine Power Systems; Bombora; Corpower), as an integrated approach reduces seabed footprint, and increases overall efficiency and resilience, among many other benefits.

The overall cost for offshore wind will continuously have to reduce to limit the increase in costs seen by consumers. As more storage and hydrogen is added to the network, the cost of doing this has to be repaid at some point by the end-user. This means there has to be a further step change in offshore wind costs. We have seen some significant developments even in the last 5-10 years,
but there is plenty of room for further innovation.
Operation and maintenance on these large offshore sites that are to be located further and further away from shore presents another challenge. Perhaps a realistic solution here is to implement a floating island to carry out major component repairs, and house service teams for a duration of time - similar to oil rigs protocol.
By 2050, there should be plenty of lessons learnt, new innovations, new products, redesigned systems, retrofits and other breakthroughs with plenty of exporting opportunities to other new markets.
Reaching the UK goal of net zero is not enough though unfortunately. In COVID-terms, we all live in the same bubble – the global bubble. Unless the global reliance on fossil fuels can be reduced to such an extent that we do not damage the environment, our time on earth is finite. To quote David Attenborough: Many individuals are doing what they can. But real success can only come if there is a change in our societies and in our economics and in our politics.


Comments